Interactive data visualization on the web with R
Carson Sievert
Slides: https://workshops.cpsievert.me/
Slides released under Creative Commons
1 / 16
About me
PhD in statistics from Iowa State (defended in December)
- Taught intro to business statistics for 4 years.
- Thesis: Interfacing R with Web Technologies for Interactive Statistical Graphics and Computing with Data
Maintainer of plotly's R package (for nearly 2 years!)
- Authored the plotly book in 2016
- Received the John M. Chambers Statistical Software Award in 2017
Author of many other R packages
- LDAvis, animint, pitchRx, rdom, etc
Delivered a handful of R workshops
- Most recently (solely) delivered an R workshop at plotcon
2 / 16
About my workshops
Attendees expected to bring laptop.
Materials are published online (under Creative Commons).
Blend of lecture, coding demos, and hands-on exercises.
Works best with 5-20 attendees.
3 / 16
About this workshop
Mostly a re-hash of my plotcon workshop
Day 1: Getting (re)-acquainted with R, RStudio, data wrangling, ggplot2, and plotly
- Basic R syntax and data structures
- Using
ggplotly()to convert ggplot2 to plotly - Using
layout()/style()to modify plotly objects - Tips and info for getting "un-stuck"
Day 2: Advanced plotly
- Animation
- Highlighting/filtering in multiple linked views
- Capturing plotly events in shiny
4 / 16
Some examples
5 / 16
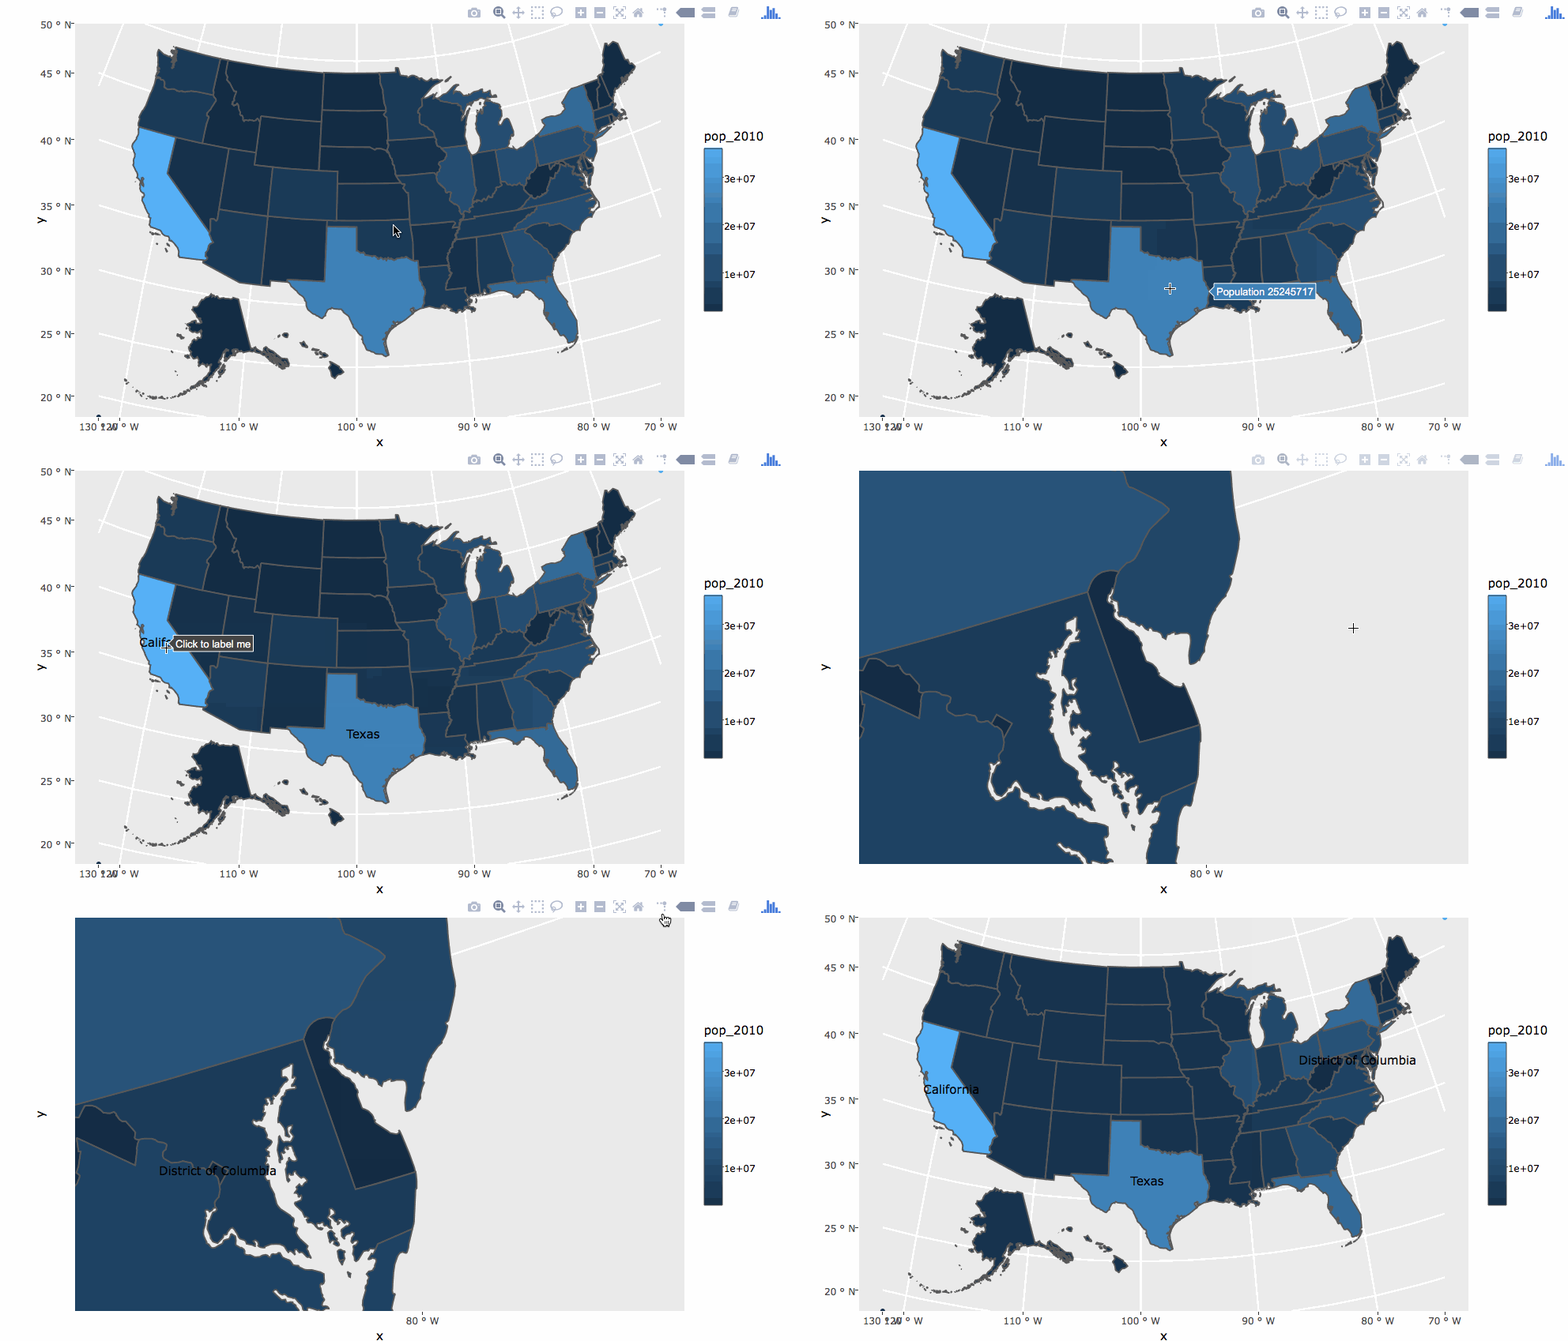
library(plotly)usa <- albersusa::usa_sf("laea")p <- ggplot(usa) + geom_sf(aes(fill = pop_2010)) ggplotly(p)6 / 16
Various ways to customize
p <- ggplot(usa) + geom_sf(aes(fill = pop_2010, text = paste(name, "had", pop_2010, "\n in 2010"))) style(ggplotly(p, tooltip = "text"), hoverlabel = list(bgcolor = "white"))7 / 16
Define custom interactions
8 / 16
The code
library(crosstalk)usd <- SharedData$new(usa)p <- ggplot(usd) + geom_sf(aes(fill = pop_2010))highlight( ggplotly(p), "plotly_hover", opacityDim = 0.8, selected = attrs_selected(line = list(color = "black")))9 / 16
Annotate on click

10 / 16
Highlighting in small multiples
d <- subset(txhousing, city %in% c("Galveston", "Midland", "Odessa", "South Padre Island"))sd <- SharedData$new(d, ~year)p <- ggplot(sd, aes(month, median, group = year)) + geom_line() + facet_wrap(~city, ncol = 2)gg <- ggplotly(p, tooltip = "year")highlight(gg, on = "plotly_click")11 / 16
Making comparisons with dynamic brush
highlight( gg, on = "plotly_click", dynamic = TRUE, persistent = TRUE, selectize = TRUE)12 / 16
Filter
s <- filter_select("years", "Years", sd, ~year)p <- ggplot(sd, aes(month, median, group = year)) + geom_line() + facet_wrap(~city, ncol = 2, scales = "free")htmltools::tagList(s, ggplotly(p, dynamicTicks = T))14 / 16
Summary
- The
ggplotly()function makes it easy to create easy interactive graphics via ggplot2. - Any plotly R object may be modified/customized via the plotly.js figure reference.
- Crosstalk's
SharedDataclass may be leveraged to:- Pose queries (via indirect/indirect manipulation)
- Make comparisons (via persistent/dynamic highlighting)
15 / 16
Thanks!
Twitter: @cpsievert
GitHub: @cpsievert
Email: cpsievert1@gmail.com
Web: https://cpsievert.me
16 / 16